The Altronic MDI (Multi-Device Interface) enables multiple AWIs (Altronic Web Interfaces) as well as optionally a DE-4000 or a Data Explorer, to be displayed on a single display with buttons to switch between them.
This guide is divided into 4 sections.
- Configuring the MDI
- Using the MDI
- Configuring the Data Explorer
- Using the Data Explorer
Configuring the MDI
Devices
The MDI is built around the concept of a device. A device in the MDI has a 1-to-1 relationship with an AWI. So the starting point for configuring a device is an already built and ejected AWI configured for that device. The MDI also allows for custom connection settings per device, so when designing and ejecting an AWI for use in an MDI, the connection settings are not as critical as the dashboard configuration.
Note: Please Refer to each devices documentation when configuring the device.
Adding a Device
Step 1 – Design and eject an AWI for the device
For comprehensive instructions on designing and configuring an AWI, refer to the Altronic Web Interface (AWI) Connection and Interface Instructions. By the end of this step, you should have a single .html file that is configured to work with the device you intend to set up in the MDI.
Step 2 – Upload the AWI
The starting point to configure a new device in the MDI is to upload an AWI for that device. This step performs 3 critical functions:
- Provides to the MDI the device profile data json embedded in the ejected AWI, that may have originated from a device profile spreadsheet.
- Provides to the MDI some default connection settings embedded in the ejected AWI, such as poll qty, poll delay, and poll frequency. Note: these settings are provided as default values, but can be overridden as needed in the MDI device configuration interface.
- Provides to the MDI the dashboard config embedded in the ejected AWI. This dashboard config will be used as the display for this device when it is selected as the active on-screen device while operating the MDI.
On the MDI, click ‘Devices’ on the left panel, then at the bottom, under the section titled ‘Add New Device’ click ‘Upload AWI’.
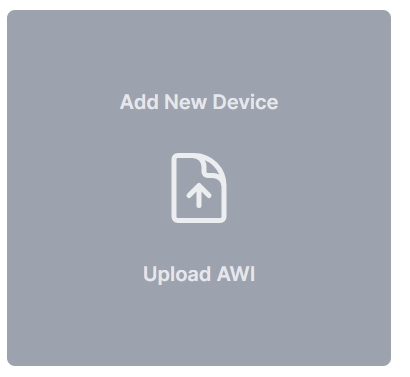
A file selector will appear.
Next, using the file selector, choose the AWI .html file for the device you want to add.
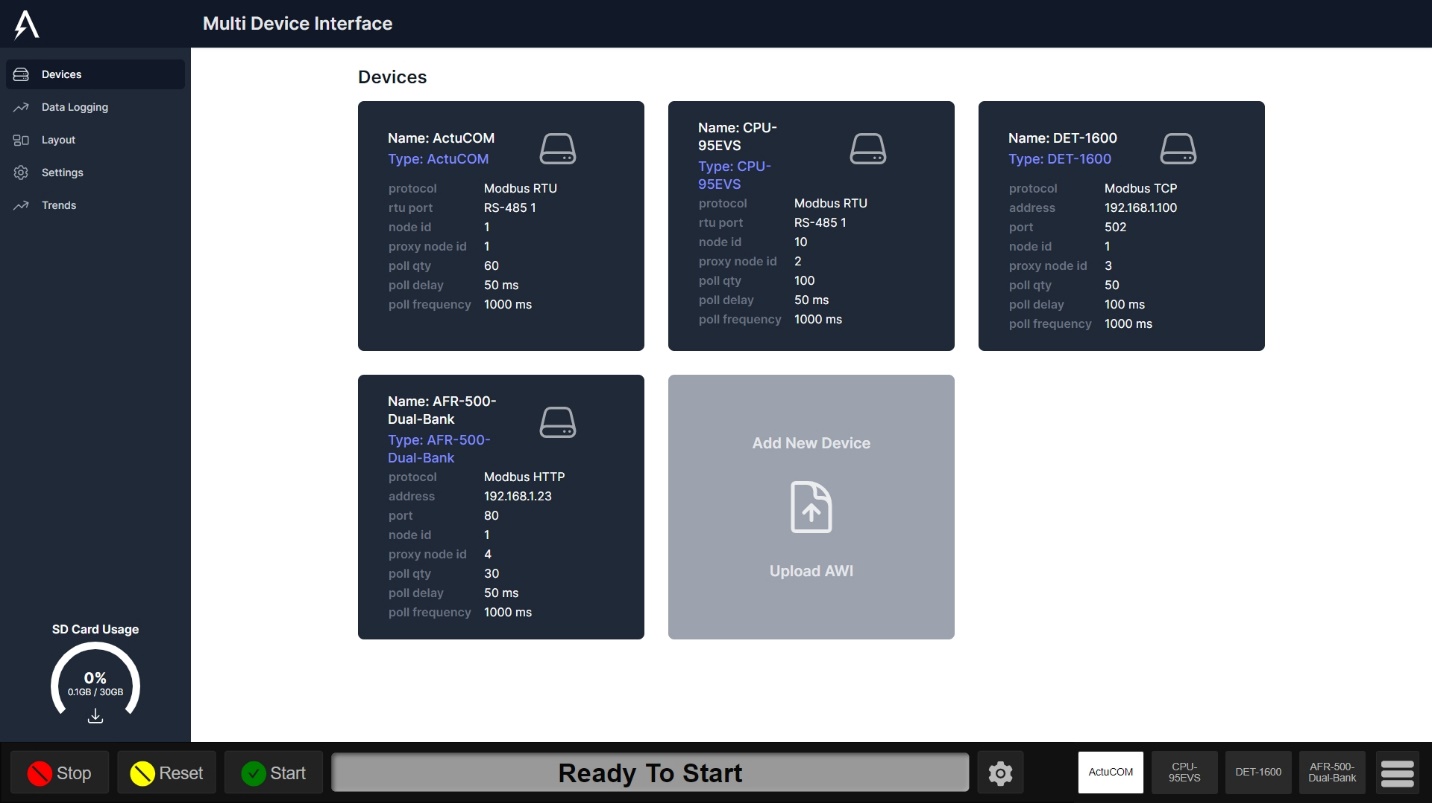
Finally, the new device will appear under the ‘Devices’ section that is at the top of the Devices page.

Note that the devices section shows a card for each configured device with a summary of their name, type, and all configured connection settings.
Next Steps: Configure the Device to connect and receive data.
Configuring a Device
On the MDI, click ‘Devices‘ on the left panel, then under the section titled ‘Devices‘ locate the device you wish to configure.
Notice the devices listing shows a summary card for the device containing its name, type, and configured connection settings.
Step 1 – Open the Device Settings
Click anywhere on the card of the device you wish to configure.
A Device Settings dialog will open.

Step 2 – Edit the Device Settings
On the left-hand side of the Device Settings dialog, each connection setting is listed in an editable field.
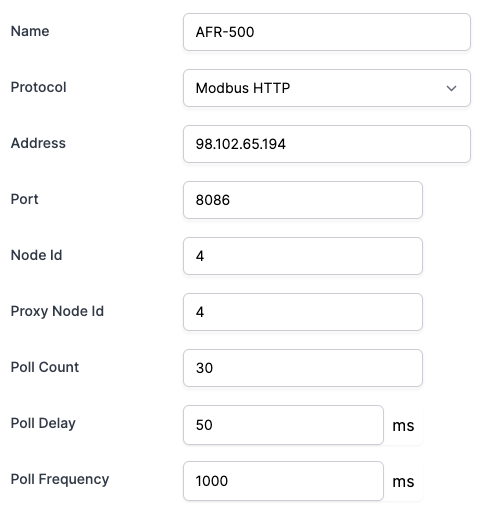
Name
This is a friendly name for the device. It defaults to the Device Type but can be changed if needed.
This name will be used throughout the MDI, such as on the Data Logging page and the Layout page. It can be changed at any time, but you may want to take care in selecting the name considering the text will be used in a button to activate the device as the active on-screen AWI. A very long name will make the button very wide, leaving less room for additional buttons.
Protocol
This defaults to Modbus HTTP, which is Altronic’s protocol for Modbus over HTTP supported by the DE-4000 and the ACM-4000. Other options include Modbus TCP and Modbus RTU. Please make this selection first as it will impact other connection settings displayed below.
Note: The CAN and CAT CDL protocols are not yet enabled in this release.
Address and Port
These fields are displayed when either Modbus HTTP or Modbus TCP is selected as the protocol. An IP address or host name can be entered in the Address field. A numeric HTTP or TCP port should be entered in the Port field.
RTU Port
This field is displayed when Modbus RTU is selected as the protocol. A drop-down allows for the selection of either RS-485 port 1 or 2.
Node Id
This will default to the Node Id of the ejected AWI that was uploaded to create this device. It should be specified according to the Modbus node id (sometimes called a Unit or Slave) of the device on the bus.
Proxy Node Id
This field is used as a unique node number to reference the device in the gateway.
Poll Count
This is the max number of Modbus registers that will be read in a single request/poll. Many devices have a max number of registers that can read at one time.
Poll Delay (ms)
This is the time (in milliseconds) of delay between each read of registers in a block on the bus. Many devices need a bit of time in between reads.
Poll frequency (ms)
This is the frequency time (in milliseconds) of each full cycle of register reads. For example, if the poll frequency is set to 1000 ms and all configured channels are read in 480 ms, the system will wait 520 ms before reading all the registers again. If, however, the system takes more than 1000 ms to read all configured channels, it will immediately start reading all channels again, after the configured poll delay.
Step 3 – Click Save
When you are done making changes to the above fields, click ‘Save Changes’
If you wish to exit the Device Settings dialog without saving any changes made, simply click anywhere outside the dialog. The dialog will close and all the unsaved changes will be lost.
Downloading a Device AWI
You can download an AWI that was uploaded for a device. This could be used to make changes and then re-upload, or it could be used on a different machine or shared with another user.
On the MDI, click ‘Devices’ on the left panel, then under the section titled ‘Devices’ locate the device which you want to download its AWI.
Note: AWI’s Downloaded from the MDI will have the settings stored for the MDI. On Next Upload of an AWI that was downloaded, it will default to the settings when downloaded.
Step 1 – Open the Device Settings
Click anywhere on the card of the device you wish to download its AWI.
A Device Settings dialog will open.

Step 2 – Click Download AWI
On the right side of the Device Settings dialog, click ‘Download AWI’
A file should be downloaded to the Download directory (or a directory specified using a file selector, if one appeared)
Click anywhere outside the Device Settings dialog to close it.
Replacing a Device AWI
Note: If the AWI you wish to upload is for a new device, see the section titled ‘Adding a Device’
If for an existing device, you want to upload a new AWI to replace the existing one (for example if the device profile or dashboard config has changed), utilize this section.
On the MDI, click ‘Devices’ on the left panel, then under the section titled ‘Devices’ locate the device which you want to replace its AWI.
Step 1 – Open the Device Settings
Click anywhere on the card of the device you wish to upload a new AWI.
A Device Settings dialog will open.

Step 2 – Click Upload AWI
On the right side of the Device Settings dialog, click ‘Upload AWI’
A file selector will appear.
Next, using the file selector, choose the AWI .html file to replace for the selected device.
Click anywhere outside the Device Settings dialog to close it.
Deleting a Device
Note: While data logs for a deleted device are still maintained in the data logging database for archival purposes, the data can no longer be viewed in the Data Explorer once the device is deleted. Creating a new device of the same type will not associate the old data with the new device.
On the MDI, click ‘Devices’ on the left panel, then under the section titled ‘Devices’ locate the device which you want to delete.
Step 1 – Open the Device Settings
Click anywhere on the card of the device you wish to delete.
A Device Settings dialog will open.
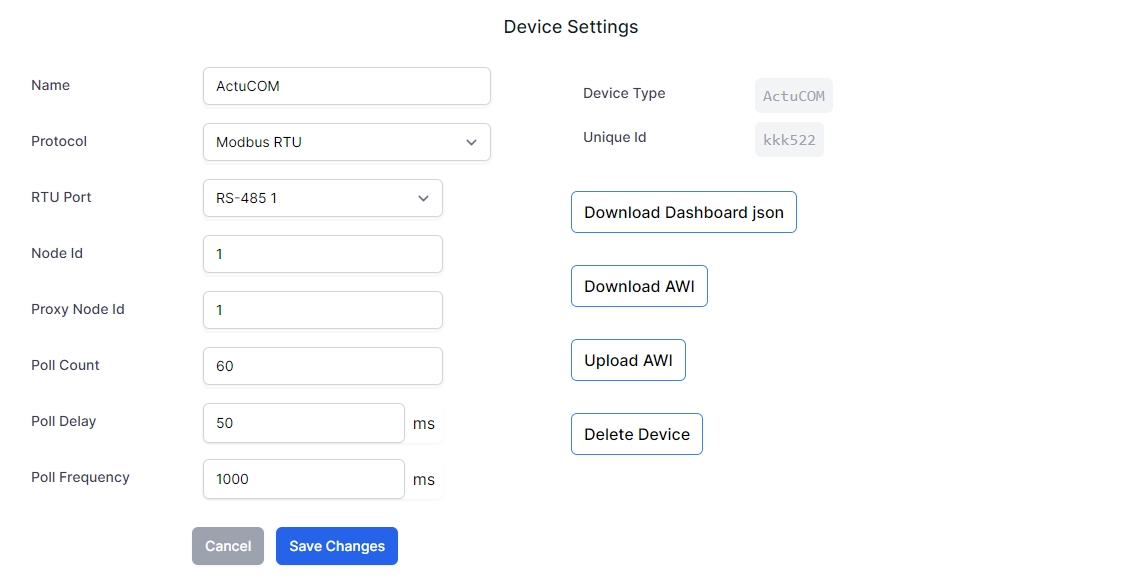
Step 2 – Click Delete Device
On the right side of the Device Settings dialog, click ‘Delete Device’
A confirmation dialog will appear.
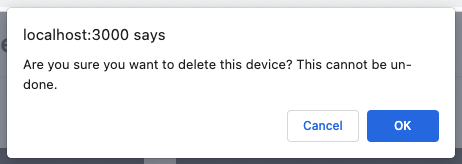
Step 3 – Click to Confirm
After ensuring that you want to permanently delete this device, click the OK button on the confirmation dialog.
Data Logging
The Data Logging section of the MDI allows you to see which devices have data logging enabled and to switch on or off data logging for any configured device.
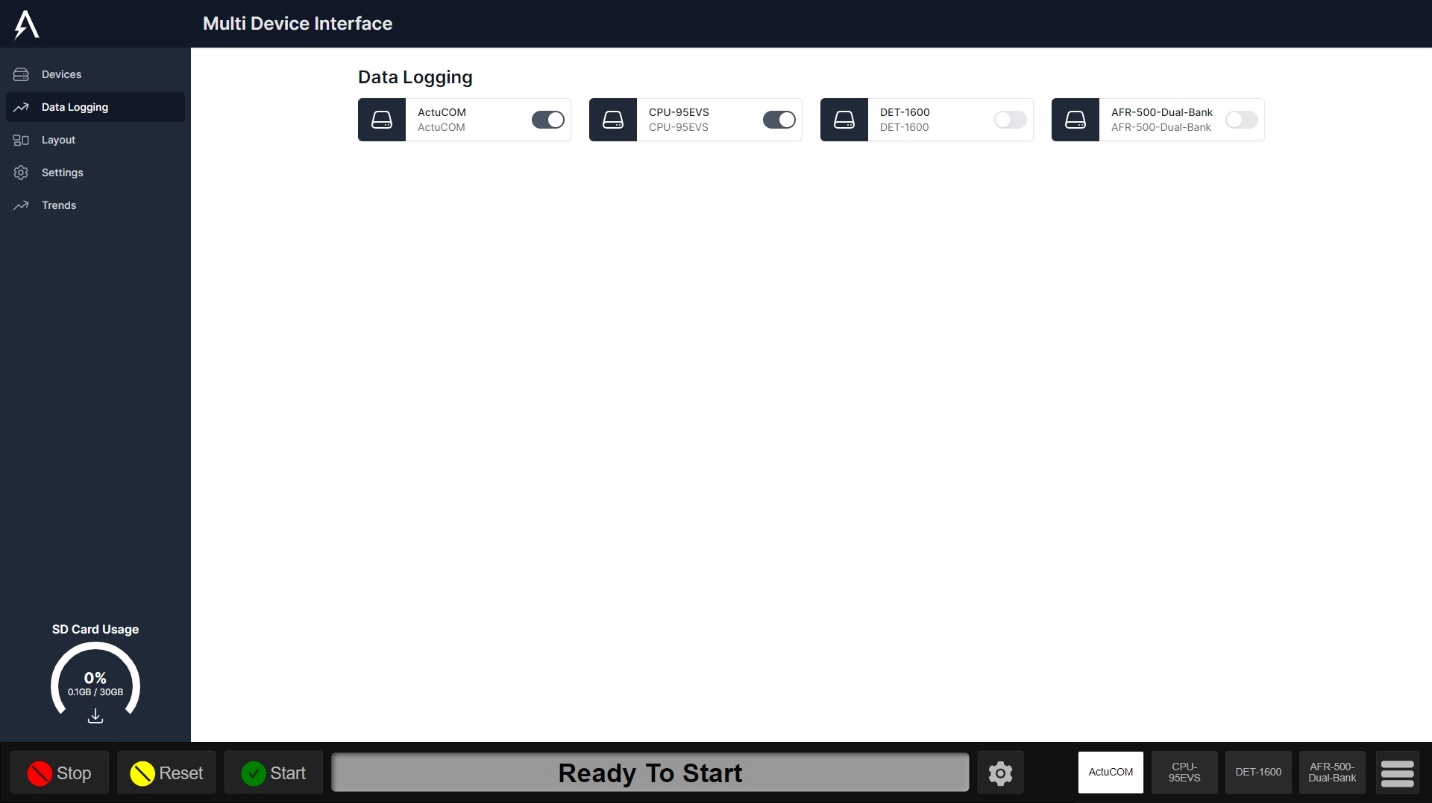
To turn on data logging for a device, click the toggle. It will slide to the right and the background will turn dark.
To turn off data logging for a device, click the toggler. It will slide to the left and the background will turn light.
Layout
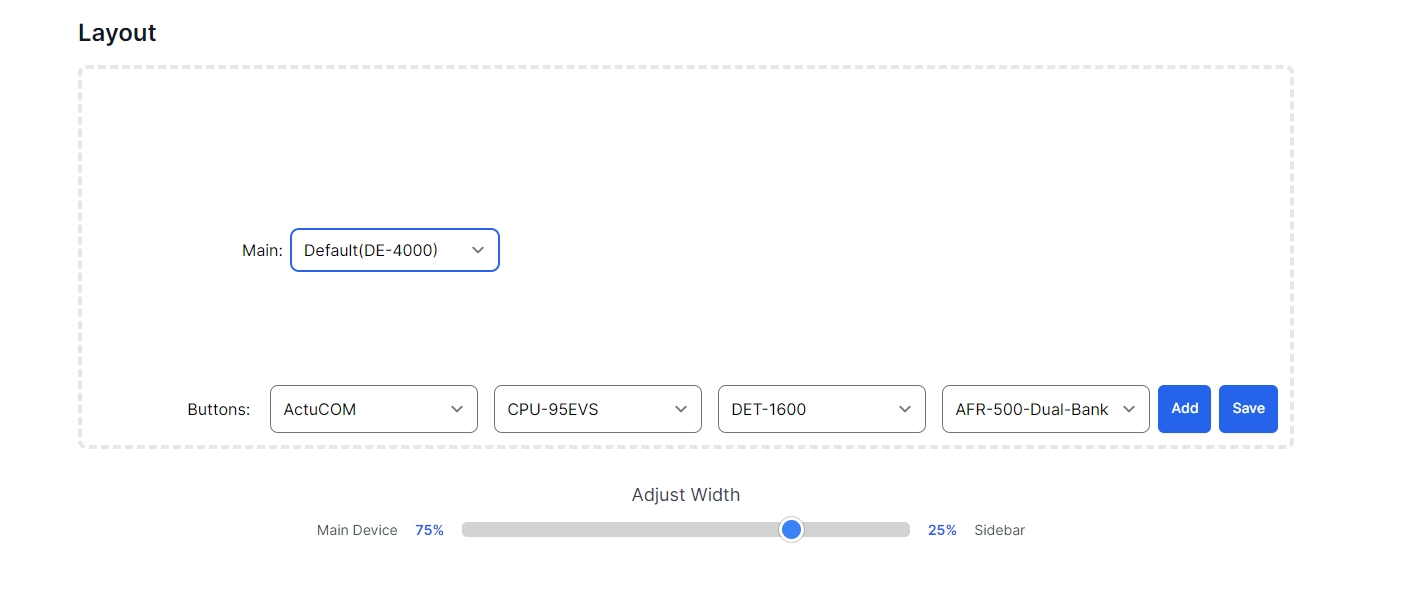
The Layout section of the MDI allows you to specify which devices will appear on-screen when the MDI is being used, including which order the devices will appear in, through buttons on the bottom-right of the screen.
Main Device
The main device will be displayed on the left side of the initially loaded screen where the DE-4000 is seen in these screenshots.
The MDI defaults to having the DE-4000 as the main device displayed, with the option of multiple AWIs displayed to the right of it, on a wide display.
Note: the field labeled ‘Main: ‘ shows the value ‘DE-4000’ to show this default configuration.
Step 1 – Navigate to the Layout Screen
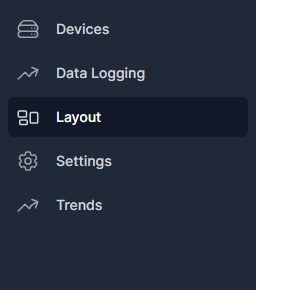
Step 2 – Select the Main Device Dropdown

Step 3 – Select the Main Device
Select Default to Display the DE-4000.
Select a Configured Device to display that devices AWI.
Select Custom URL to use an IP or webpage.

Step 3 – Save
Once the Main Device is selected. Click the save button to save changes.

AWI Buttons
The large dotted-outline rectangle represents the screen when the MDI is in use.
The interface for adding and removing device/AWI buttons is in the lower-right corner of the dotted-outline rectangle, to match where the buttons are located when the MDI is in use.
Adding a Button
To add a button, click ‘Add’.
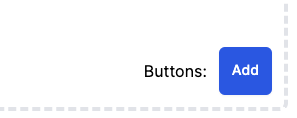
A drop-down appears to the left of the ‘Add’ button.

This drop-down represents a button that can be associated with a device/AWI.
Changing a Button
To change a button, click the drop-down and select the device/AWI you want for that button.

Removing a Button
To remove a button, click the drop-down and select ‘(remove)’.
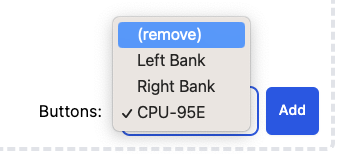
The drop-down will disappear.
Saving Button Changes
Layout Width
The layout width slider will change the % of the screen the Main Device and Sidebar(AWI’s) takes.
The Percentage of the Width is indicated above with the red arrow being the Main Device’s width and the green arrow being the Sidebars Width
Step 1 – Navigate to the Layout Screen

Step 2 – Drag the Slider to the desired width

Drag This Slider
Step 3 – Save
Once the Main Device is selected. Click the save button to save changes.

Settings
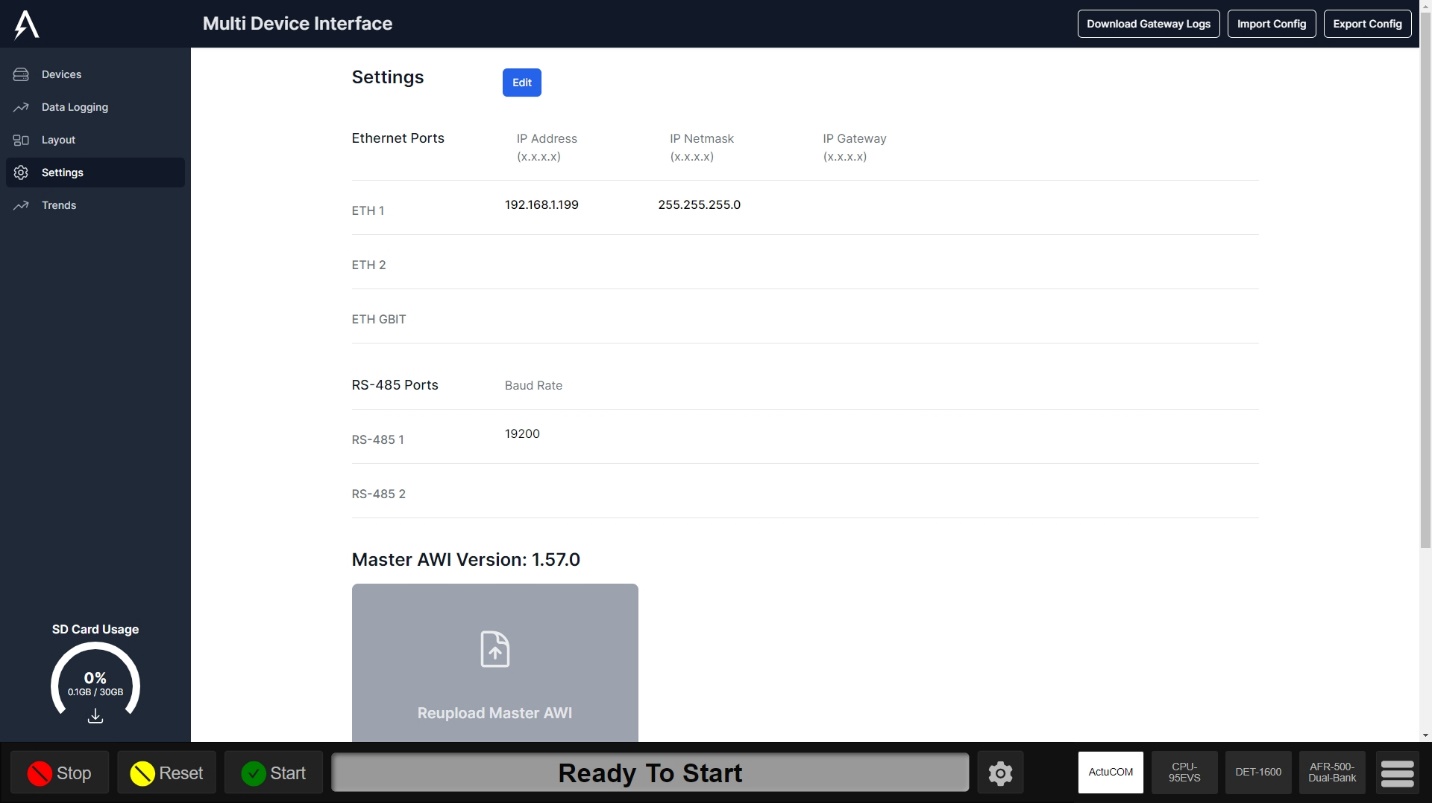
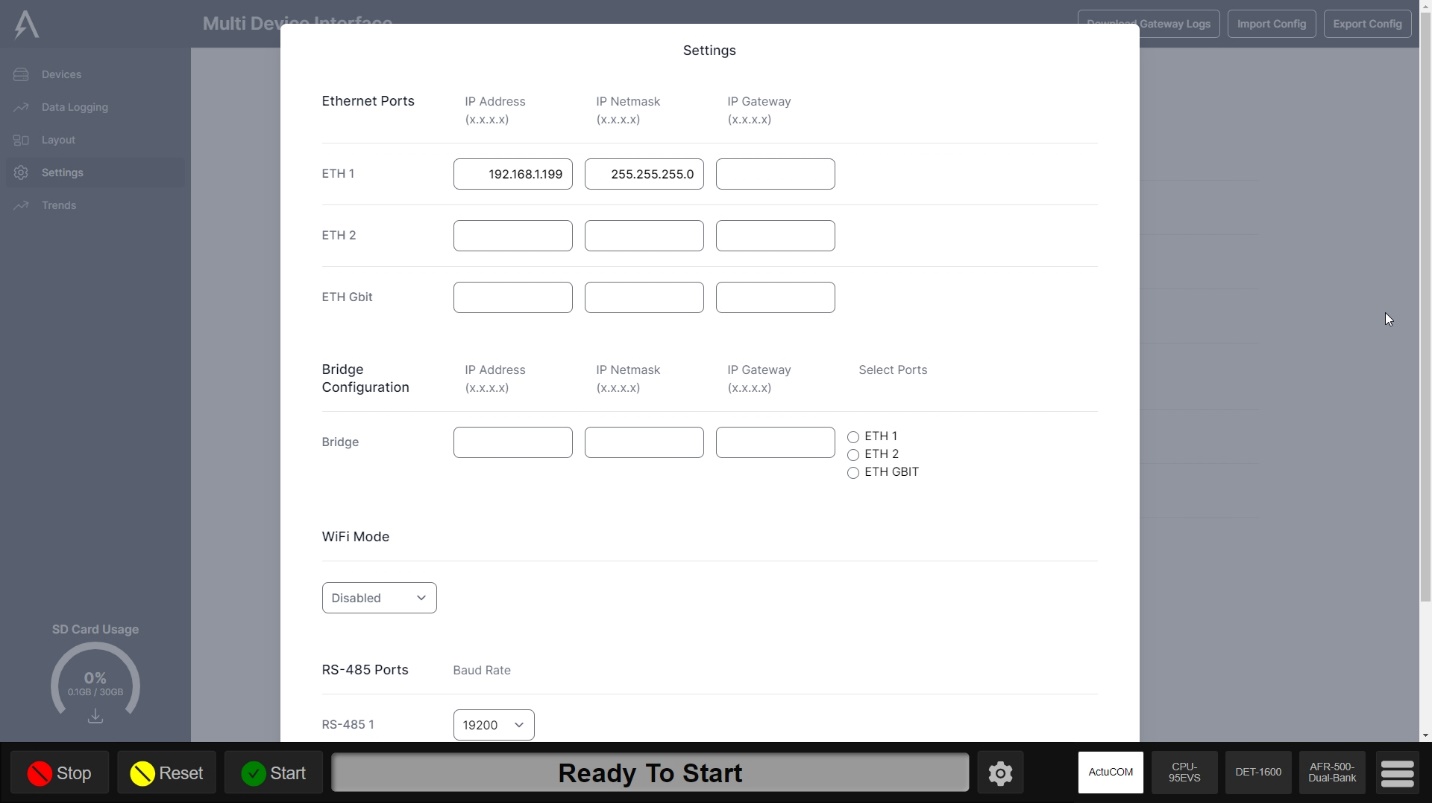
On the MDI, click ‘Settings’ on the left panel. The settings page appears:
Master AWI Upload
Step 1: Navigate to the Settings Page.

Step 2: Click on Upload/Reupload Master AWI.
Step 3: Select the Master AWI file and click open.
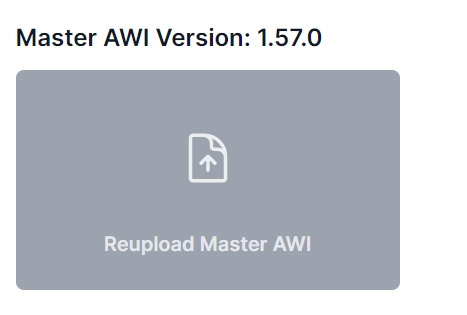
Step 4: The Text Behind Master AWI Version will indicate the AWI version uploaded.
Additional .html File Uploads
Step 1: Navigate to the Settings Page.

Step 2: Click on “Upload Additional .html File”
Step 3: Select the html file and click open.
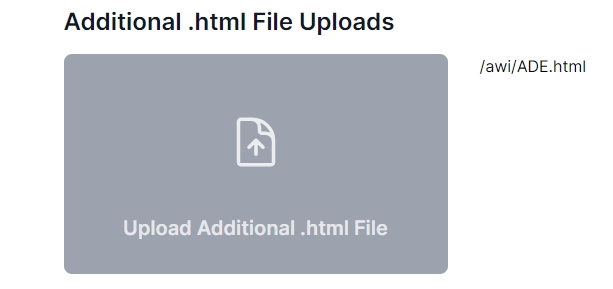
Step 4: The Text Beside will indicate uploaded files.
Download Gateway Logs
Step 1: Navigate to the Settings Page.
Step 2: Click on the “Download Gateway Logs” button.

Step 3: A file names logs.txt will be downloaded.
Importing Config
Step 1: Navigate to the Settings Page.

Step 2: Click on the “Import Config” button.
Step 3: A popup will appear asking to choose a file, click “choose file”
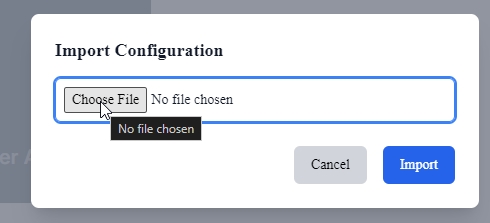
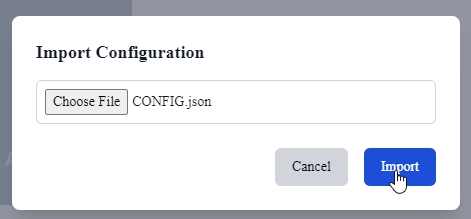
Step 4: Select the .json config file
Step 5: Click “Import”
Exporting Config
Step 1: Navigate to the Settings Page.

Step 2: Click on the “Export Config” button.
Step 3: A file named “exported-config.json” will be downloaded.
Editing Setings
Step 1: Navigate to the Settings Page.

Step 2: Click on the “Edit” button.
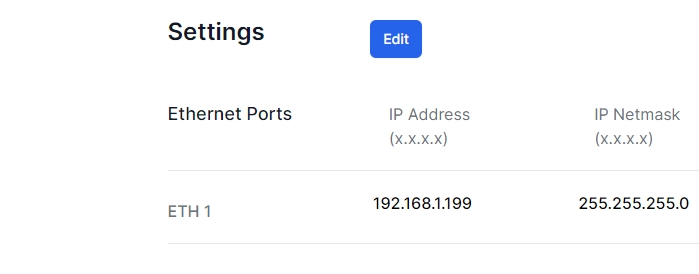
Step 3: Edit the Desired Settings
Explanation of Settings
- Ethernet Ports
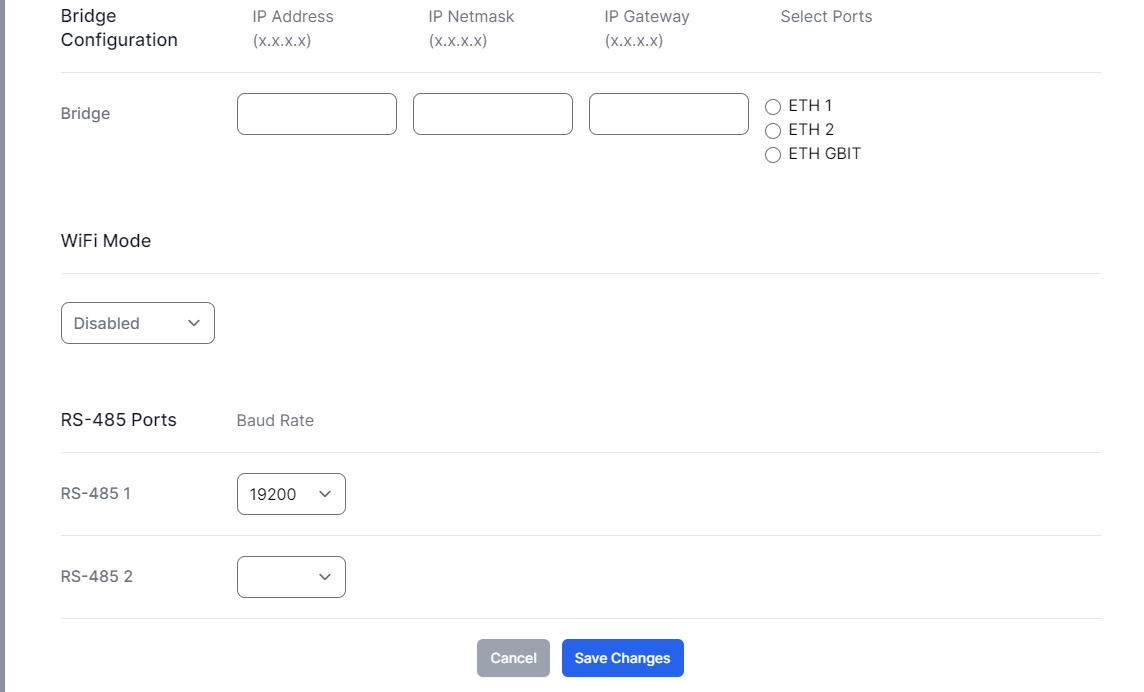
- Bridge Configuration
- When setting up a bridge, the Selected Ports will act as 1 ethernet port with the same IP address. Use this setting if you want to have multiple Ports on the same subnet.
- Wifi Mode
- Client Mode
- Enter the desired SSID and password of the wifi network to connect to.
- Access Point
- Enter the Required Fields to access the MDI over WIFI.
- Note: To access the MDI over wifi, connect to the wifi access point and enter the IP address entered in this field ip:3000/awi. You must also set the wifi IP address to the same subnet as the ip address entered here.
- Client Mode
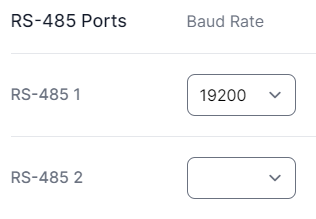
- RS-485 Ports
- For the RS-485 Ports you are able to set the baud rate for port 1 or 2.
- Datalogging
- DE-4000 Time Zone
- Enter the time zone used on the DE-4000. This is to ensure the time is correctly adjusted when logging data to the correct Time zone.
- Datalogging Interval
- This is the Minimum amount of time we wait before logging a new value. Choose between 1 – 10 seconds.
- DE-4000 Time Zone
Step 4: Scroll to the bottom and click “Save Changes”
SD Card Usage
While Datalogging, The SD Card will store all registers on the device locally.
Checking SD Card Storage
If the SD Card has less than 2 GB of storage than the SD Card will no longer store data to be exported.
One the MDI Configuration Screen, In the bottom left the SD Card storage will be shown.
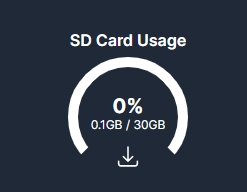
You can see in this situation we are using .1 GB out of 30GB or 0 % of the SD Card’s Storage.
Exporting SD Card Data
Data can be exported from the SD Card to a USB Drive connected to the ACM-4000 in a .csv format.
Step 1: Insert the USB Drive into the ACM-4000.
Step 2: Navigate to the MDI Configuration Screen.
Step 3: Click the Export Button on the SD Card Usage.

Step 4: Choose to Delete or keep data after export.
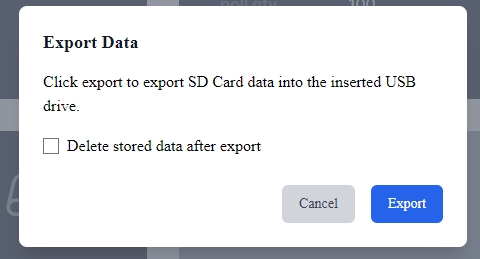
Step 5: Click the Export Button.

Step 6: Wait Until the Progress bar reaches 100%
Step 7: Remove the USB Drive.
Using the MDI
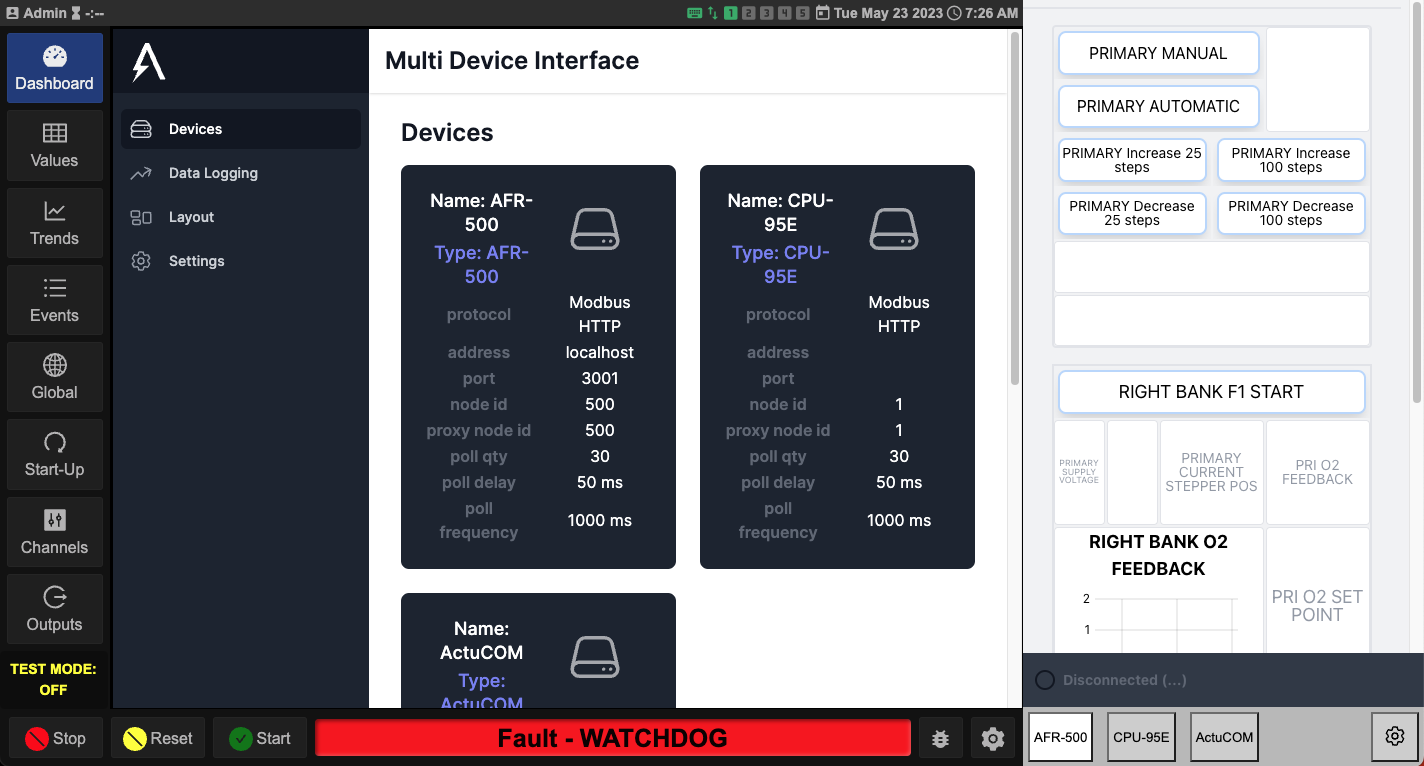
While in use, the MDI screen is divided into 3 main sections. The left part of the screen will display the DE-4000 (if one is present) or otherwise a Data Explorer or other configured full-screen device. The right part of the screen displays AWIs. On the bottom right is a button bar which shows which AWIs are available and allows for switching between each AWI.
Switching Between AWIs
Click each AWI button on the bottom right to switch between each AWI display. The button that is white shows which AWI is currently visible.
Viewing an AWI Full-Screen
In order to show an AWI using the full screen width, click the already active/white AWI button on the bottom right. The AWI will toggle from being displayed on the right side to being displayed on the full width of the page.

Note that while the AWI is taking up the full-screen width, the status bar of the DE-4000 is still visible below.
Press the button again to toggle the AWI to be displayed smaller on the right.
Accessing the MDI Configuration Screens
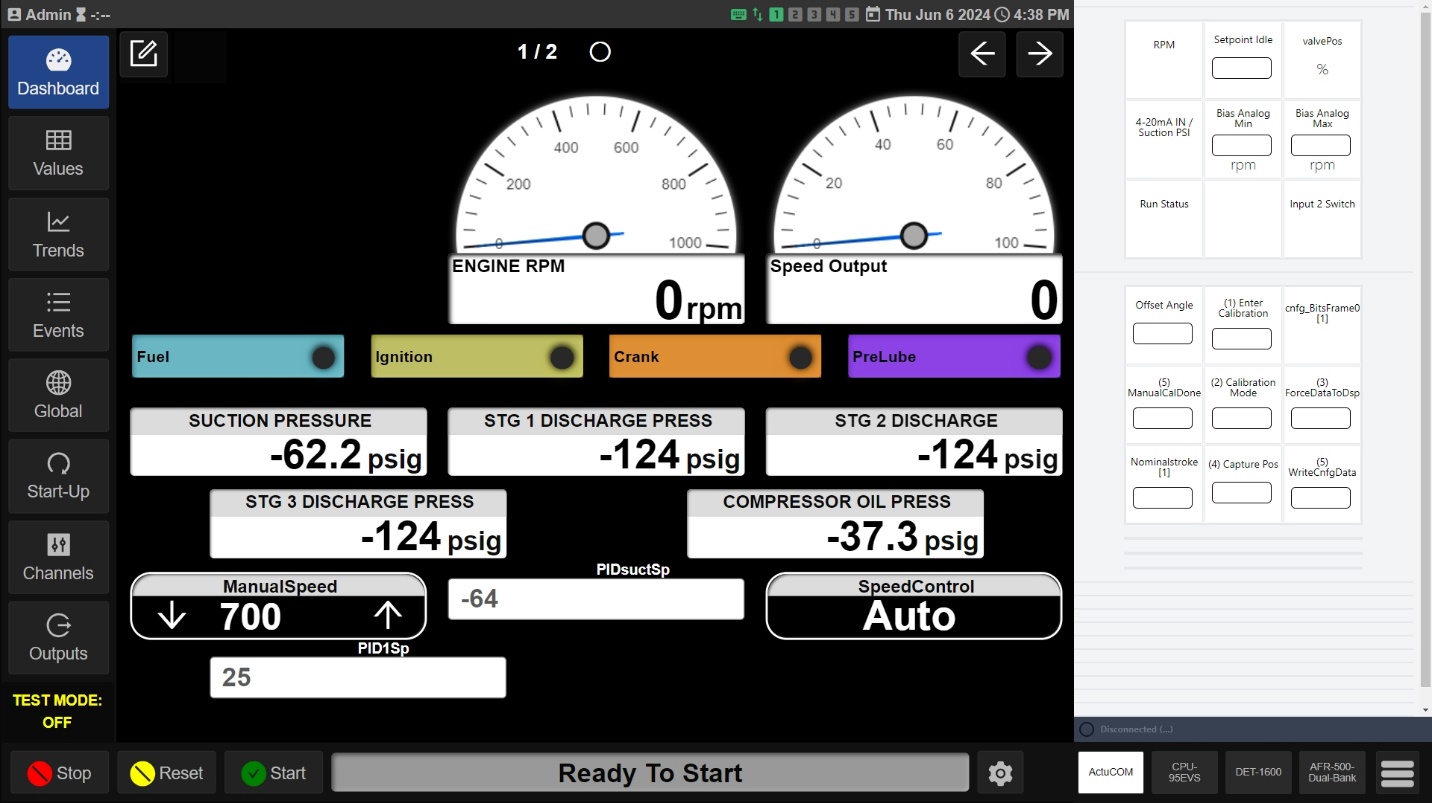
While using the MDI, you can access the MDI Configuration Screens by pressing the hamburger icon on the bottom right, to the right of the AWI buttons:

The MDI Configuration Screens will be displayed with the DE-4000 status bar still below. When you are finished making configuration changes, press the gear icon again and the display will refresh with the new settings activated.
Configuring the Data Explorer
The Data Explorer allows for chart visualization of data logging and trending. Each device with logging enabled in the MDI will have its channels available for selection in the Data Explorer. Each chart can have multiple series and can even combine channel data from different devices into a single chart.
Adding a Chart
On the main screen of the Data Explorer:

Click the ‘Add Chart’ button.
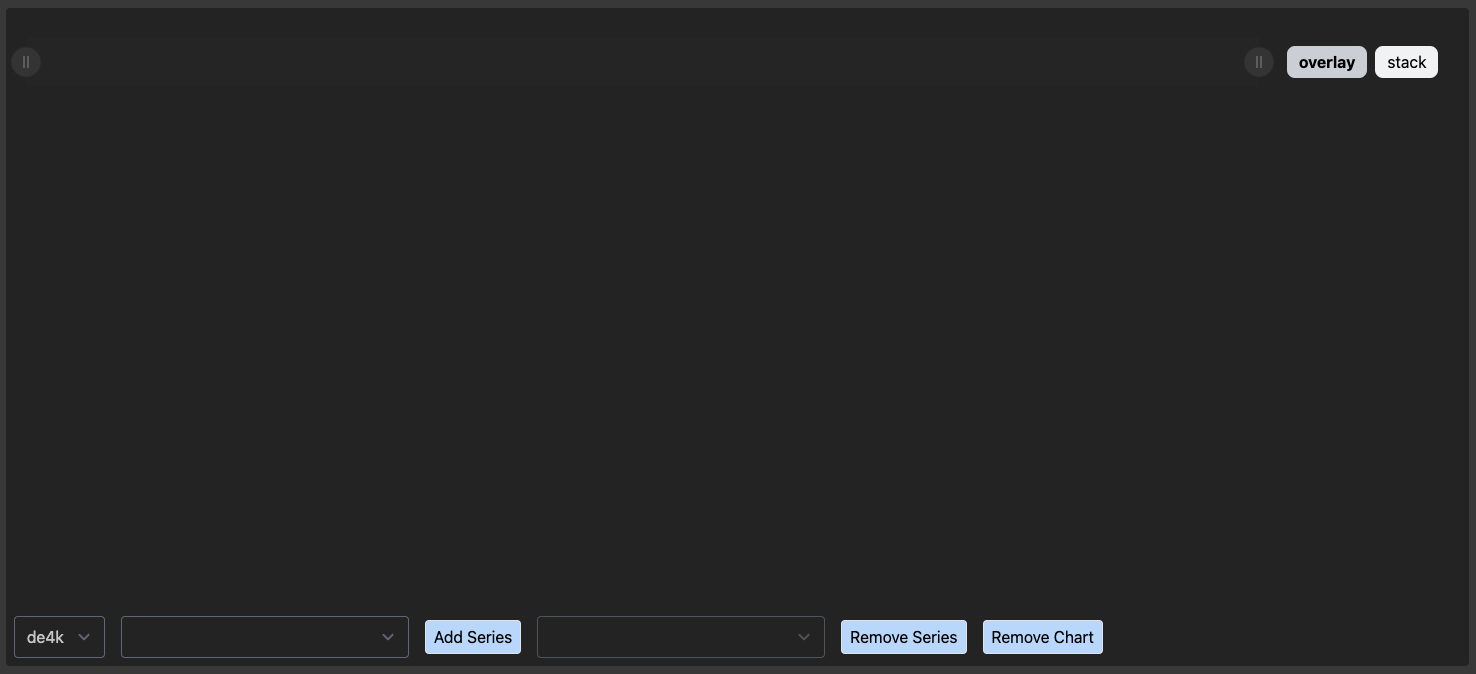
A blank chart will appear:
Adding a Series
Select the device name in the dropdown box on the bottom left of the chart.
Next select the channel for which you want to add a series in the second dropdown box.
Click the ‘Add Series’ button.
A series line will appear on the chart:
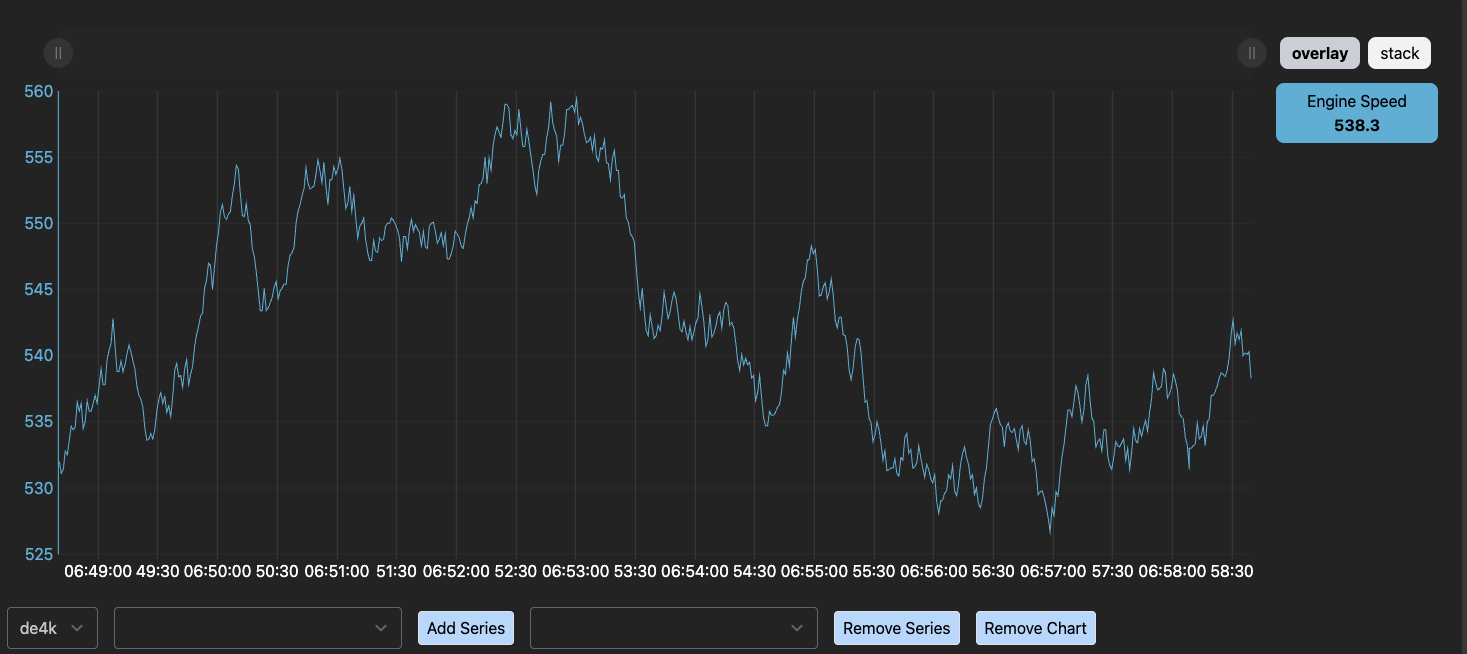
Repeat the above steps (Adding a Chart, Adding a Series) to add the desired charts and chart series to the Data Explorer.
Removing a Series
Select the channel for which tou want to remove a series in the third dropdown box.
Click the ‘Remove Series’ button.
The series will be removed from the chart.
Removing a Chart
Click the ‘Remove Chart’ button.
A confirmation dialog will appear.

Click the ‘OK’ button.
The chart will disappear.
Using the Data Explorer
Selecting a Time Span
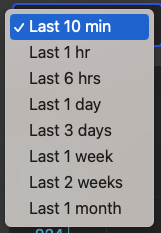
The Data Explorer will display data over different time spans. All chart will use the same time span, which is selected in a drop-down box.
To select the current time span for display, click the dropdown in the top bar:
Select the desired time span in the box.
All charts will be refreshed to show data for the selected time span.
Light and Dark Mode
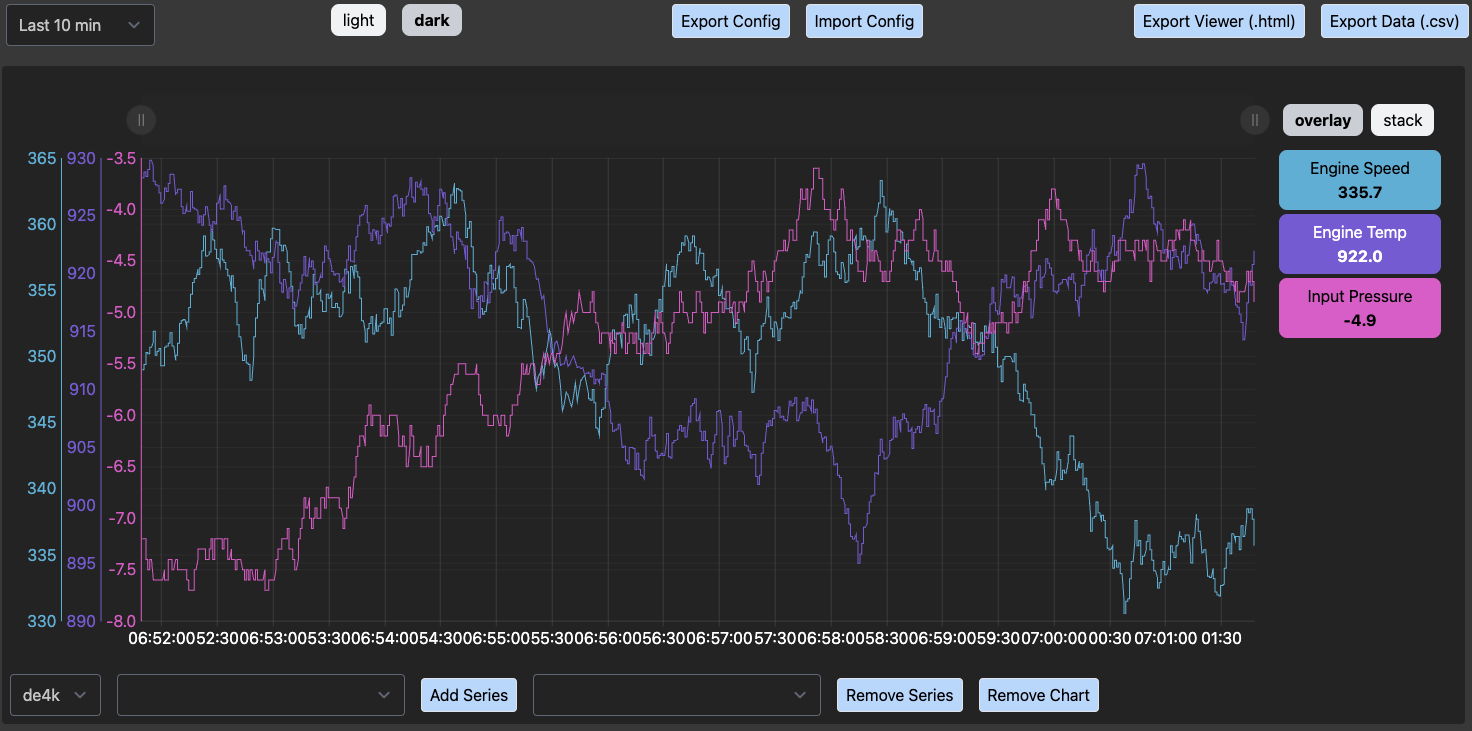
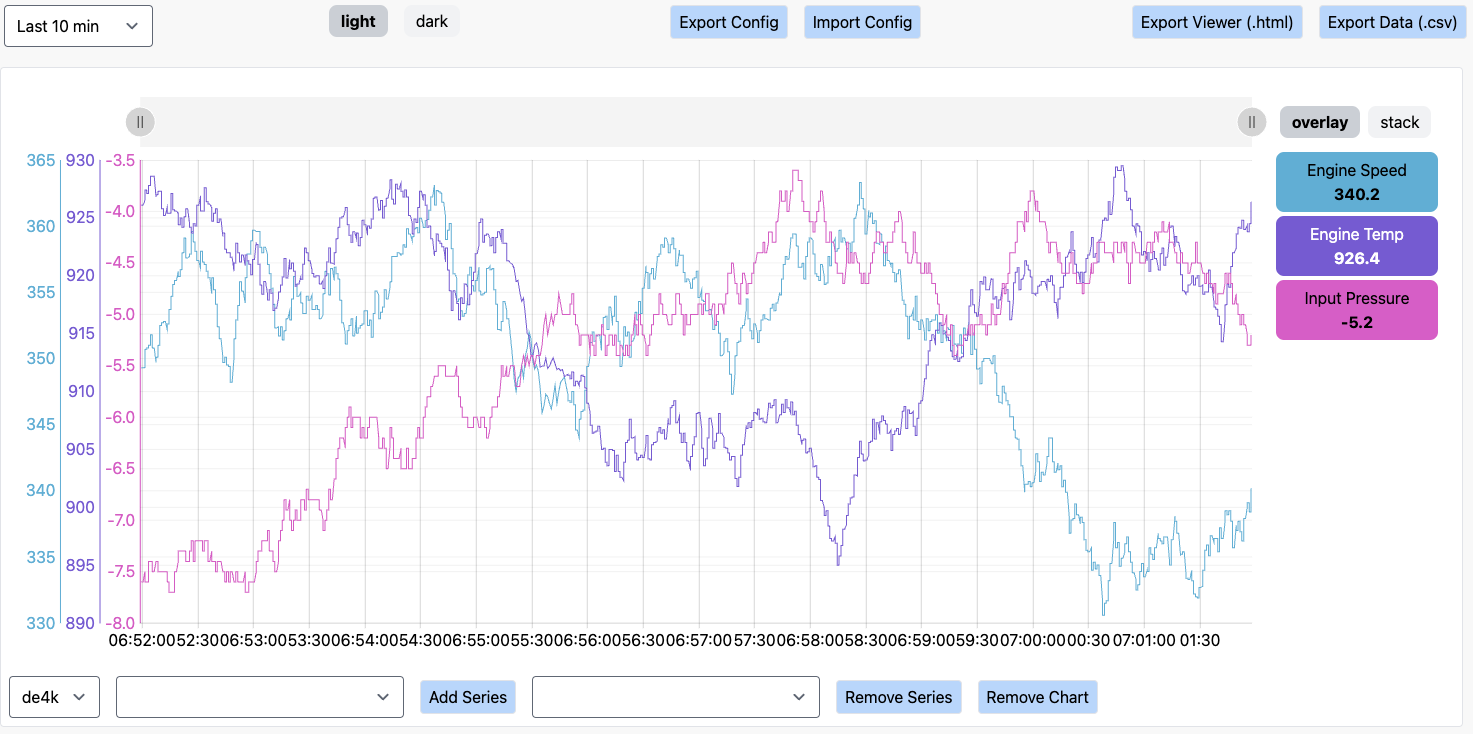
The Data Explorer has support for both light and dark mode, to aid with visibility in different lighting conditions. Toggle between these two modes by clicking either the light or dark button in the top bar:

Example – dark mode:
Example – light mode:
Exporting Chart Configs
Once you have configured one or more charts to your liking, you can export the configuration for re-use or to transfer to another user or machine.
In order to export the config, click the ‘Export Config’ in the top bar:
The system will download an exported configuration file that can later be imported to replicate the chart and series configurations at the time of export.
Importing Chart Configs
With an exported config file that you have created or that another user has provided to you, you can restore a chart and series configuration.
Note: Importing a config will replace all current chart configurations. In order to not lose any configuration you have done, export your current config before importing a config that will overwrite it.
Click the ‘Import Config’ button in the top bar:
A file selector will appear.
Next, using the file selector, choose the Data Explorer config file you wish to import.
Finally, the charts and series will load to match the configuration in the imported file.
Push Chart Config
Clicking this button will push the chart configuration from the PC connected to the HMI. This is only available when connected with a PC over ethernet or WIFI.
Pull Chart Config
Clicking this button will pull the chart configuration from the HMI to the PC. This is only available when connected with a PC over ethernet or WIFI.
Export Viewer (.html)
The current view of data can be exported into a viewer that has the charts and data embedded in the file for viewing and analyzing externally or copied to other users.
The export a viewer html file, click the ‘Export Viewer (.html)’ button in the top bar:
The system will download a viewer html file. To use the viewer, open the file in a web browser.
Export Data (.csv)
The current view of data can be exported into a comma-separated values (CSV) file for viewing and analyzing externally or copied to other users.
To export the data as a csv file, click the ‘Export Data (.csv)’ button in the top bar:
The system will download a csv file.
Zooming and Panning
Each chart contains a zoom and pan bar at the top that can be used to zoom in to data as well as pan across the selected time span.
The zoom and pan bar contains handles on the left and right. Each handle is displayed as a circle with two vertical lines:
![]()
Select and drag either handle and slide to the left or the right to zoom in or zoom out on the chart.
Example – zooming in to middle 1/3rd of the selected time span:

The lighter gray section of the zoom and pan bar between the left and right handles is itself a handle that can be dragged left or right to pan the chart across the selected time span.
Example – viewing the left 1/3rd of the selected time span:

The chart can also be panned by clicking and dragging anywhere in chart to the left or the right. The zoom and pan bar will move to indicate the portion of the selected time span currently in view.
While zoomed in, the chart contains a button on the top-right, a blue circle with a white horizontal line. Click this button to zoom all the way out on the chart:

The zoom and pan bar will zoom all the way out and the chart will show all the available data in the selected time span.
Note: while zoomed in, if the right handle in the zoom and pan bar is moved to the left the chart will pause updates. If the right handle is moved all the way to the right, live data will continue to flow into the chart.
Overlay vs. Stack
By default, multiple series on a chart will be overlaid so that each shares a single x-axis (time) and each of their y-axes (value) is displayed on the left-hand side with its corresponding min and max values:
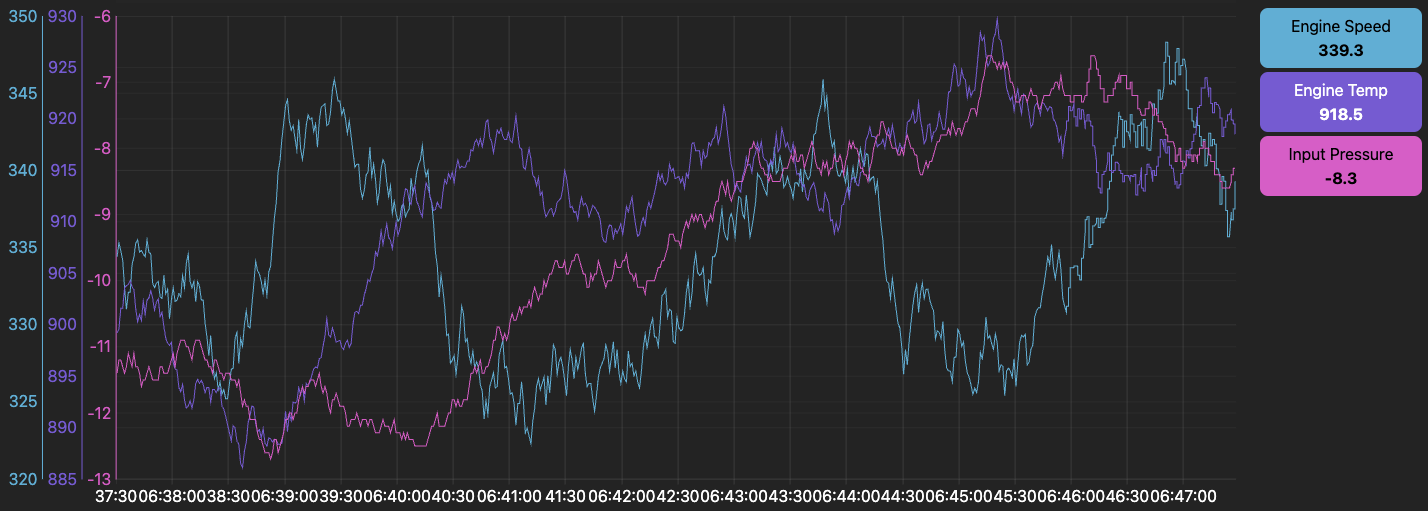
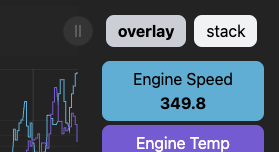
Each chart has an option to stack each series vertically so it has its own vertical space and its own y-axis region. To switch to stacked mode, click the stack button at the top-right of the chart:
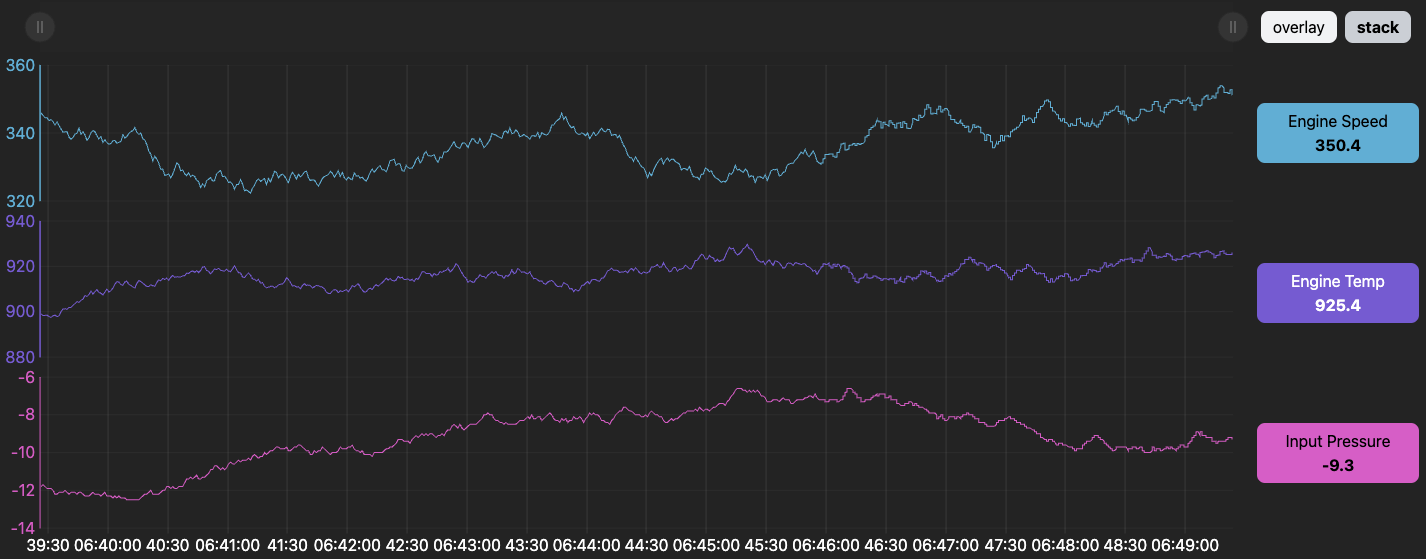
Each series will stack vertically, and each label will be spaced on the right-hand side aligned with the stacked series:
To return to the overlaid series, simply click the overlay button on the top-right of the chart.
Highlighting a Series
A chart series can be highlighted to make the series line more visible. This can be especially useful when series are overlaid and you want to make one series line easier to see amongst the others.
To highlight a series line, click the label on the right-hand side.
The label button will get a border (showing it’s selected) and the series line (in the same color as the label button) will get thicker.
Example: highlighting the Input Pressure series line:
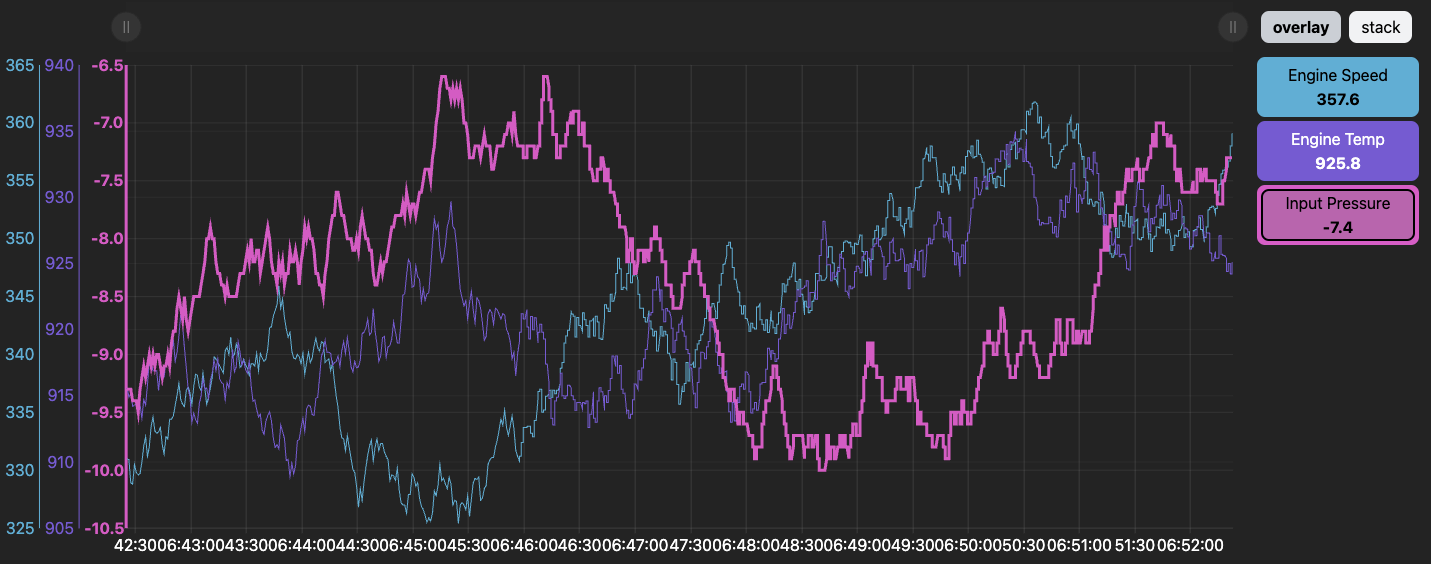
This feature can be used to highlight multiple series lines at once. Simply click an additional label button to select it as well.
Example: highlighting both the Engine Speed and the Input Pressure series lines:
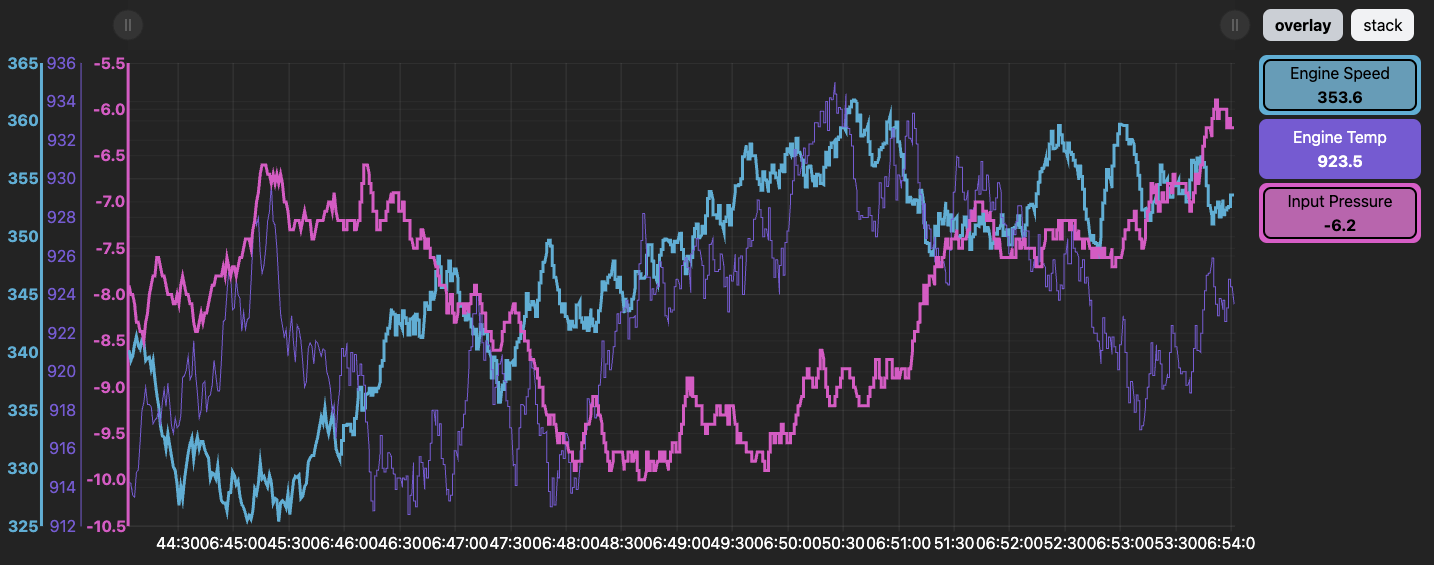
To turn off the series highlight, click the same label button. The button border will turn off (showing the series is no longer selected) and the series line will return to its normal thickness.
Example: turning off all series highlights:
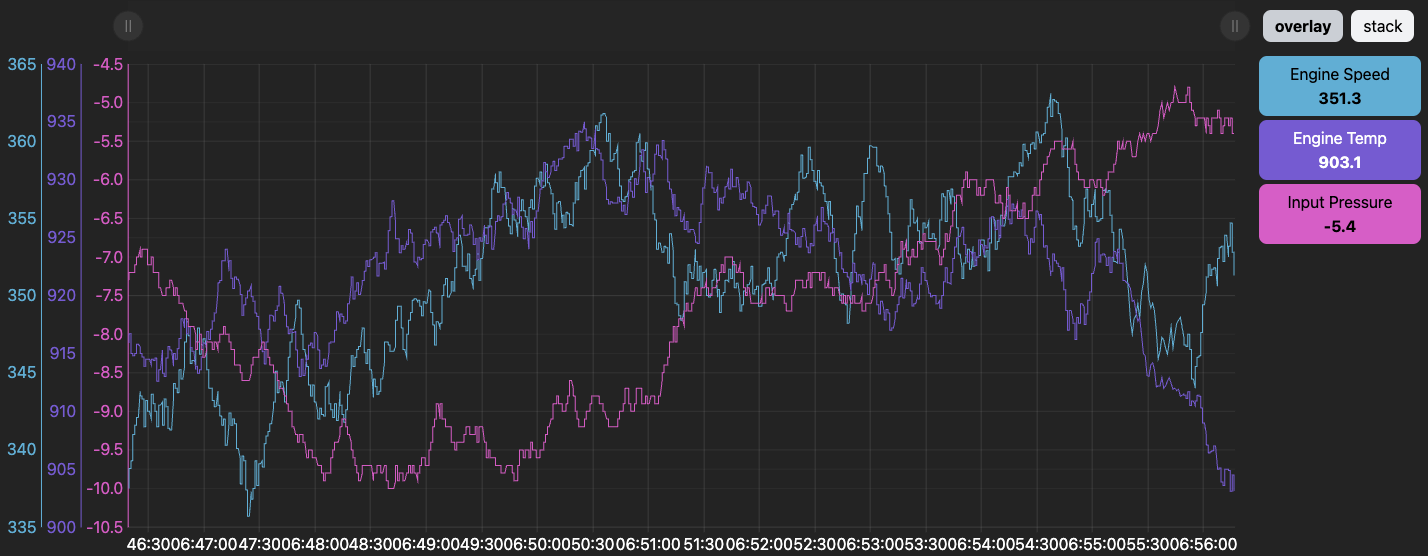
Values Cursor
In order to view the values of all series at a specific time, hover the mouse over the chart. A vertical cursor line will appear showing the specific time as well as the value of each series at that time:
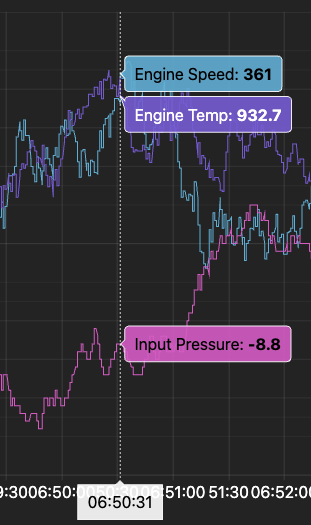
If new data is flowing in from the right (that chart is shifting data to the left), the cursor will not stick in place and you will have to move the mouse to the left again and again to view the cursor at the same spot in time. In this case, it is recommended to pause the live data flowing in by moving the right handle in the zoom and pan bar slightly to the left. See the section Zooming and Panning for more details.


